At the time of writing, there were few indications of an impending turnaround, leaving Bitcoin's (BTC) (1) daily price action lacking. Following the recent trends, the following factors are still exerting pressure on the price of bitcoin:
- Persistent fears of strict cryptocurrency regulation.
- Interest rate increases and quantitative tightening were declared by the United States Federal Reserve Policy (2).
- The weaponization of the natural resources that the European Union imports are in high demand, as are the geopolitical concerns in Russia and Ukraine (3).
- Strong risk aversion is caused by the potential for a worldwide and American recession.
The enthusiasm experienced during the 2021 bull market has largely subsided due to the current issues and difficulties, which have rendered high-volatility assets less interesting for institutional investors. This made the daily price movement uninspiring, but looking at variables over a longer time frame that gauges Bitcoin's price, investor sentiment, and valuation perceptions do present statistically significant data.
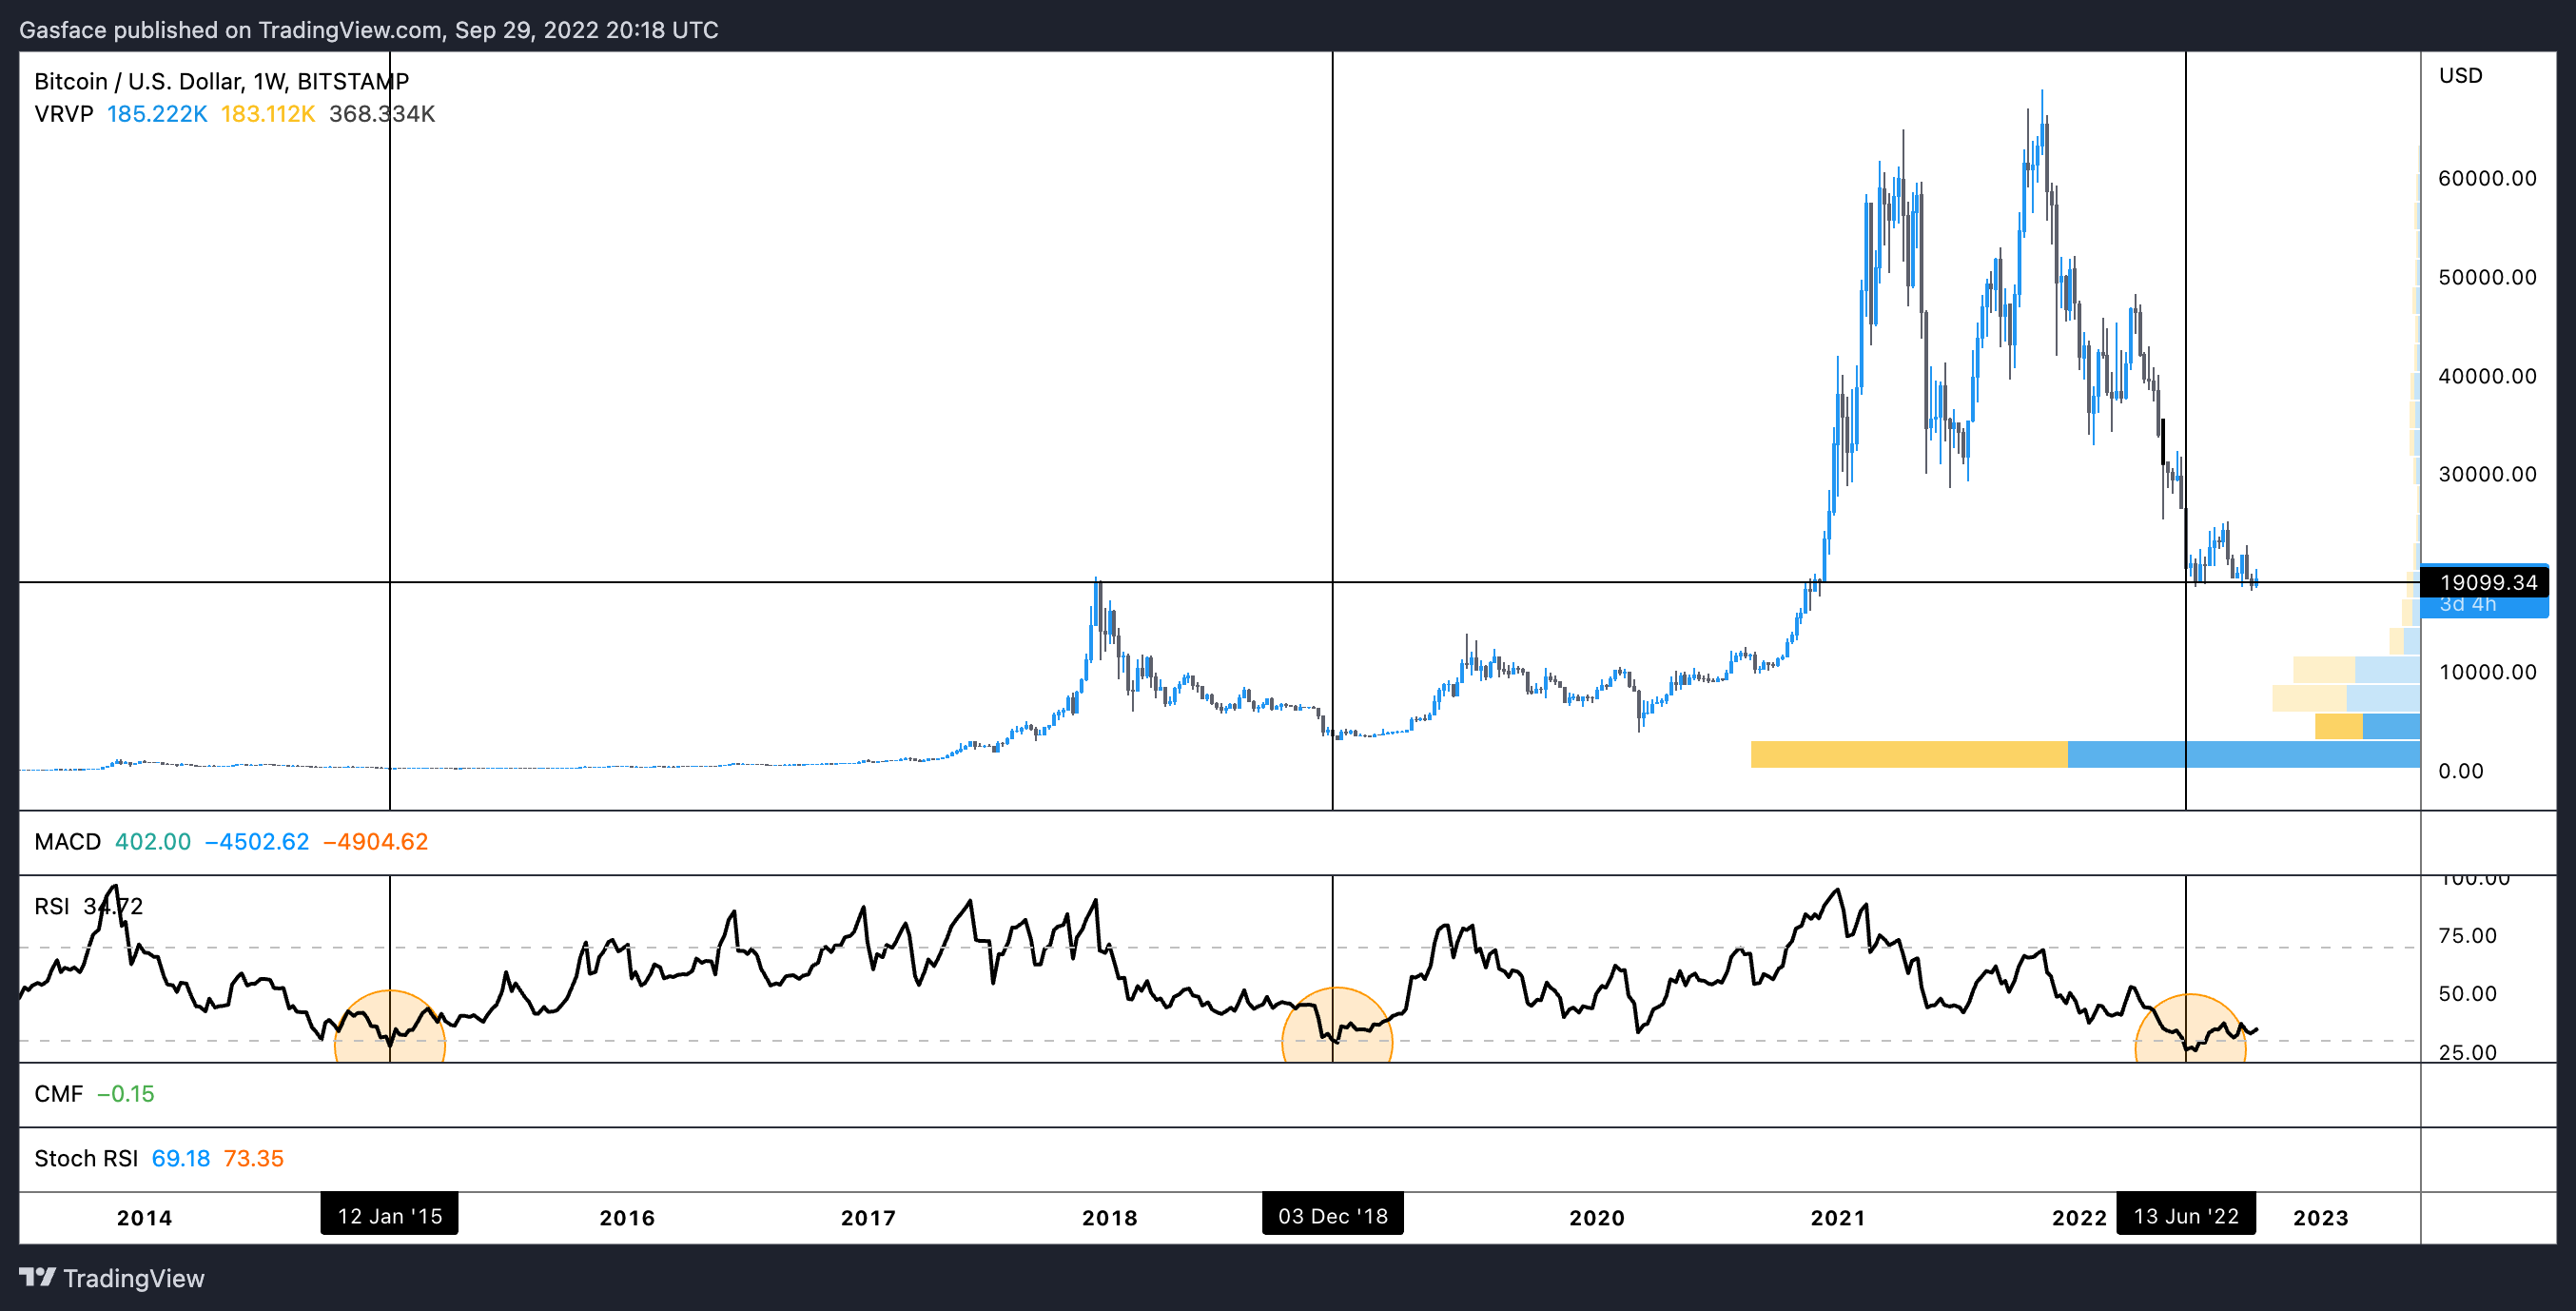
BTC's price is bumping against a long-term declining trendline on a daily and weekly timescale, and the Bollinger Bands, a straightforward momentum indicator showing two standard deviations above and below a simple moving average, are starting to contract. A big directional move is often preceded by the bands tightening, and it is typical for the price to be trading at long-term resistance.
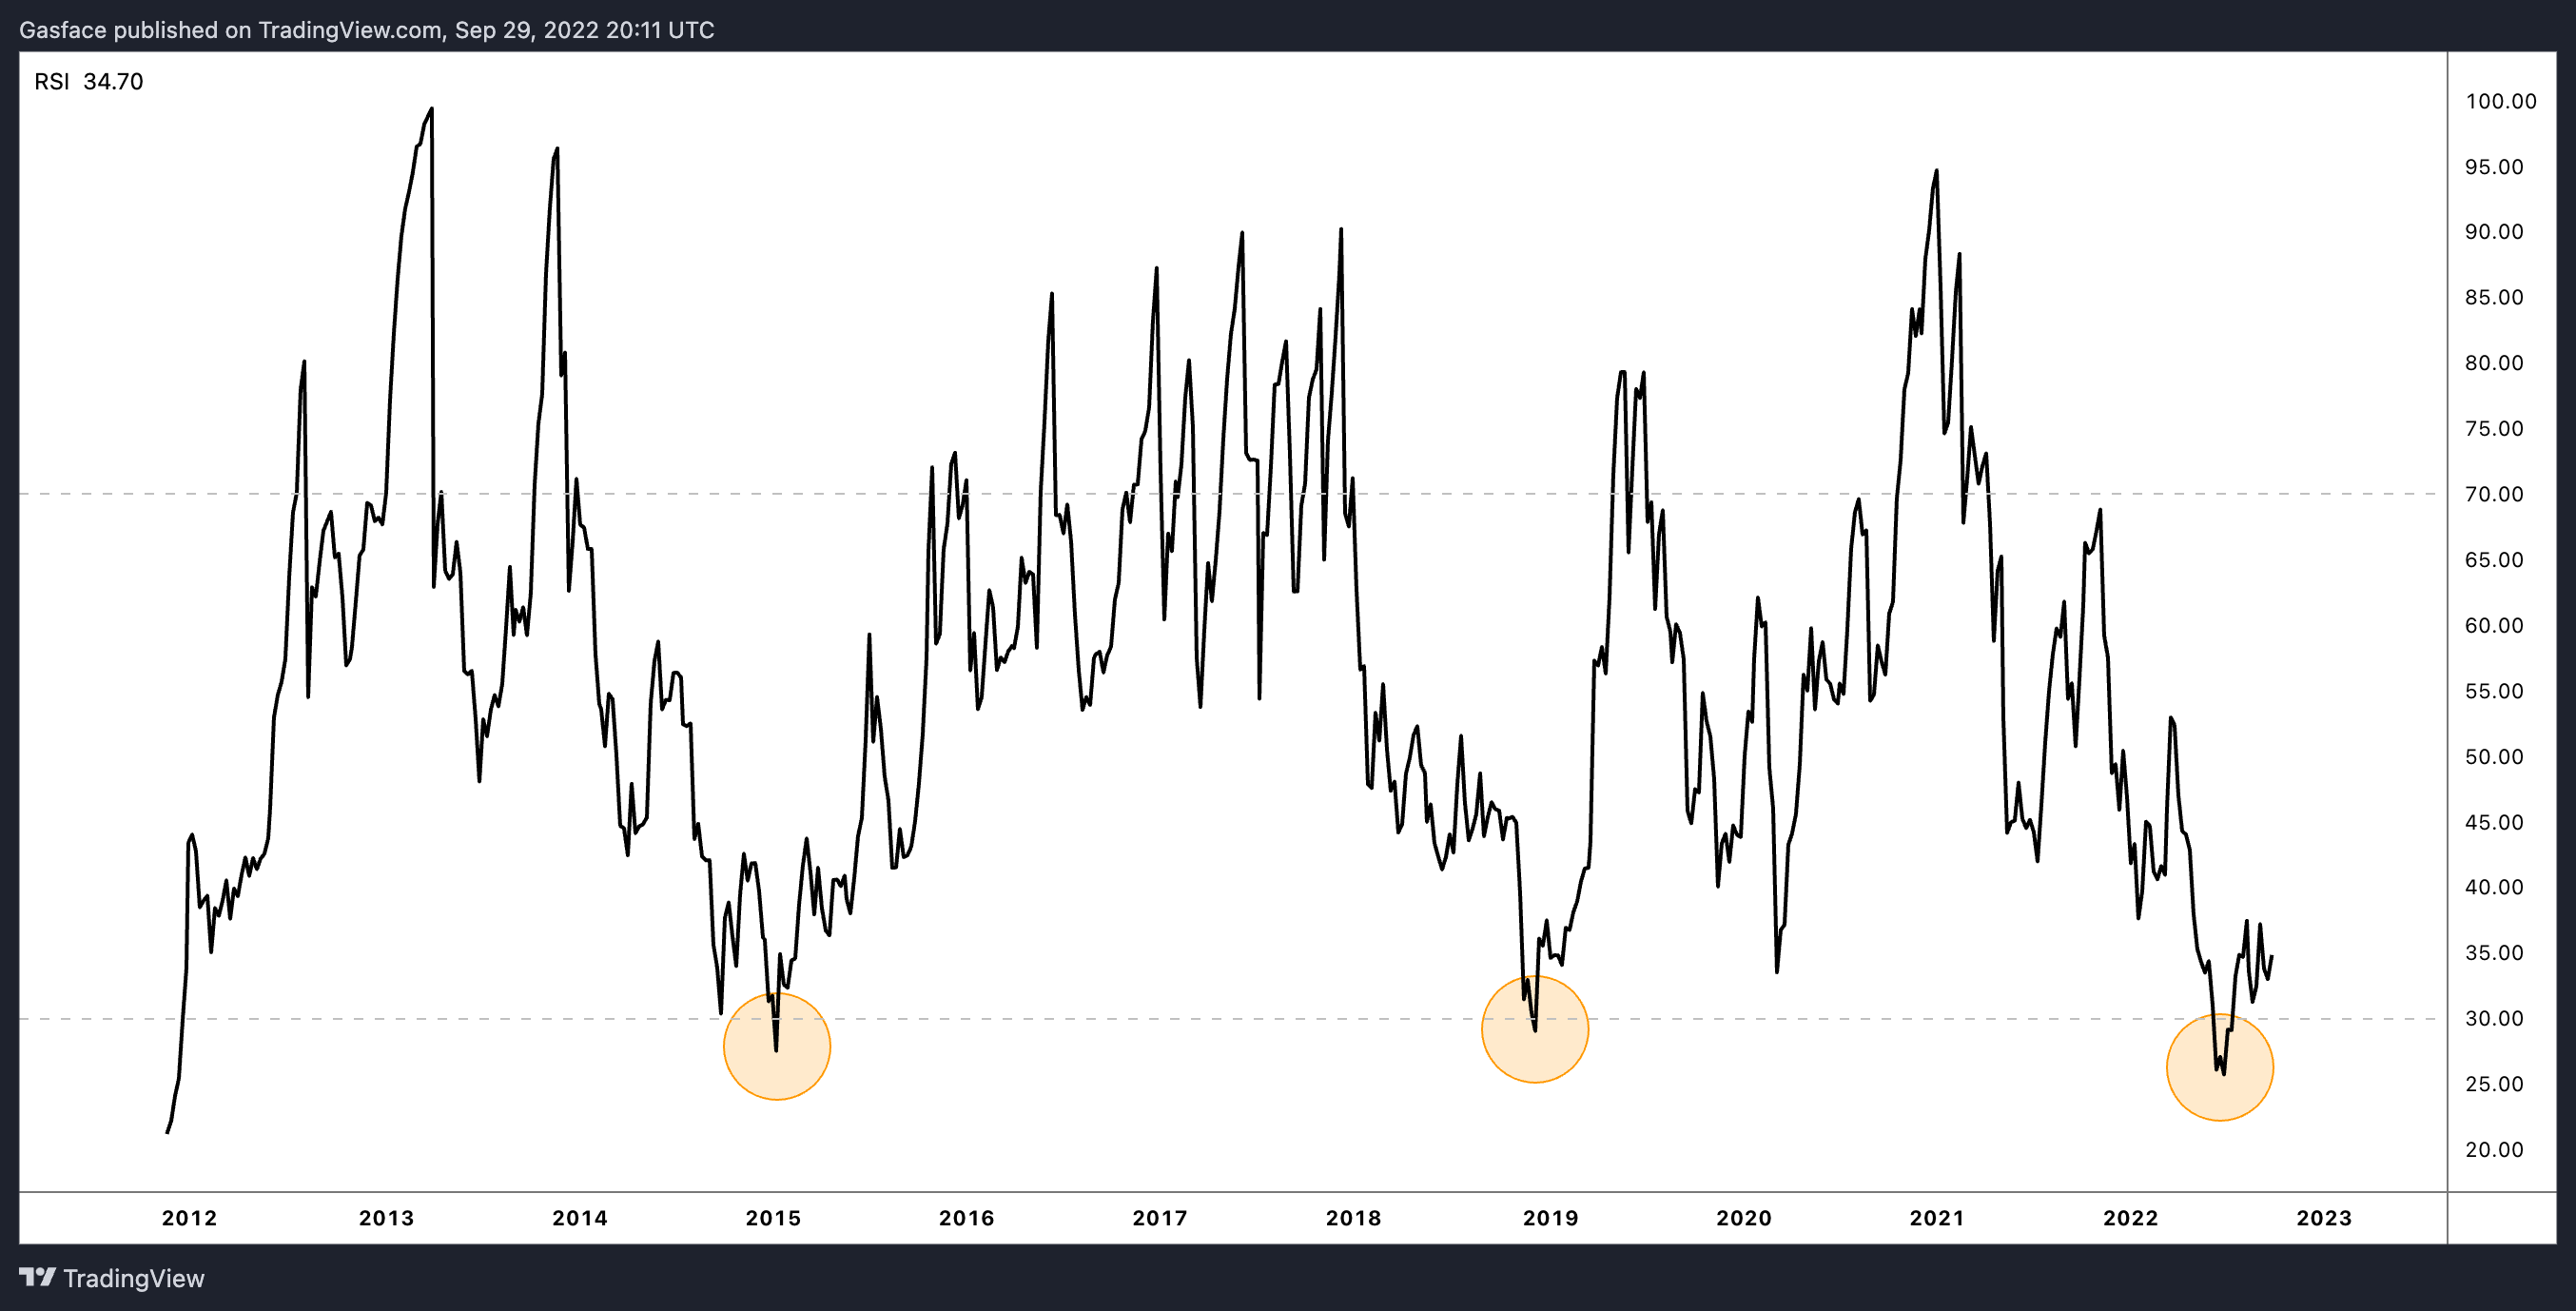
A glance at the relative strength index (RSI), when compared to Bitcoin's longer-term price action, demonstrates that buying when the RSI is significantly oversold is to be taken into account as a profitable strategy. The sell-off, which started on March 28 and ended on June 13, sent the indicator to a multi-year record low. While the situation is bad in the immediate term, a price agnostic perspective of Bitcoin and its market structure would imply that this is a good time to start building up.
While additional price declines may occur, the way Bitcoin's multi-year price action is constructed over the RSI display presents interesting aspects that have yet to be confirmed as a market bottom. Apart from this event, the increasing position size at the occurrence of an oversold weekly RSI yielded a positive result for those with brave action and reaction. While some analysts had predicted the drop to the $15-10,000 range, the buy wall at $18,000 may be absorbed and turned into a bull trap.
While the moving average convergence divergence (MACD) oscillator, similar to the RSI, is another indicator to be viewed in the longer timeframe, it became significantly oversold as Bitcoin's price fell to $17,600. While MACD crossed above the signal line, it indicated lingering in previously untested territory.
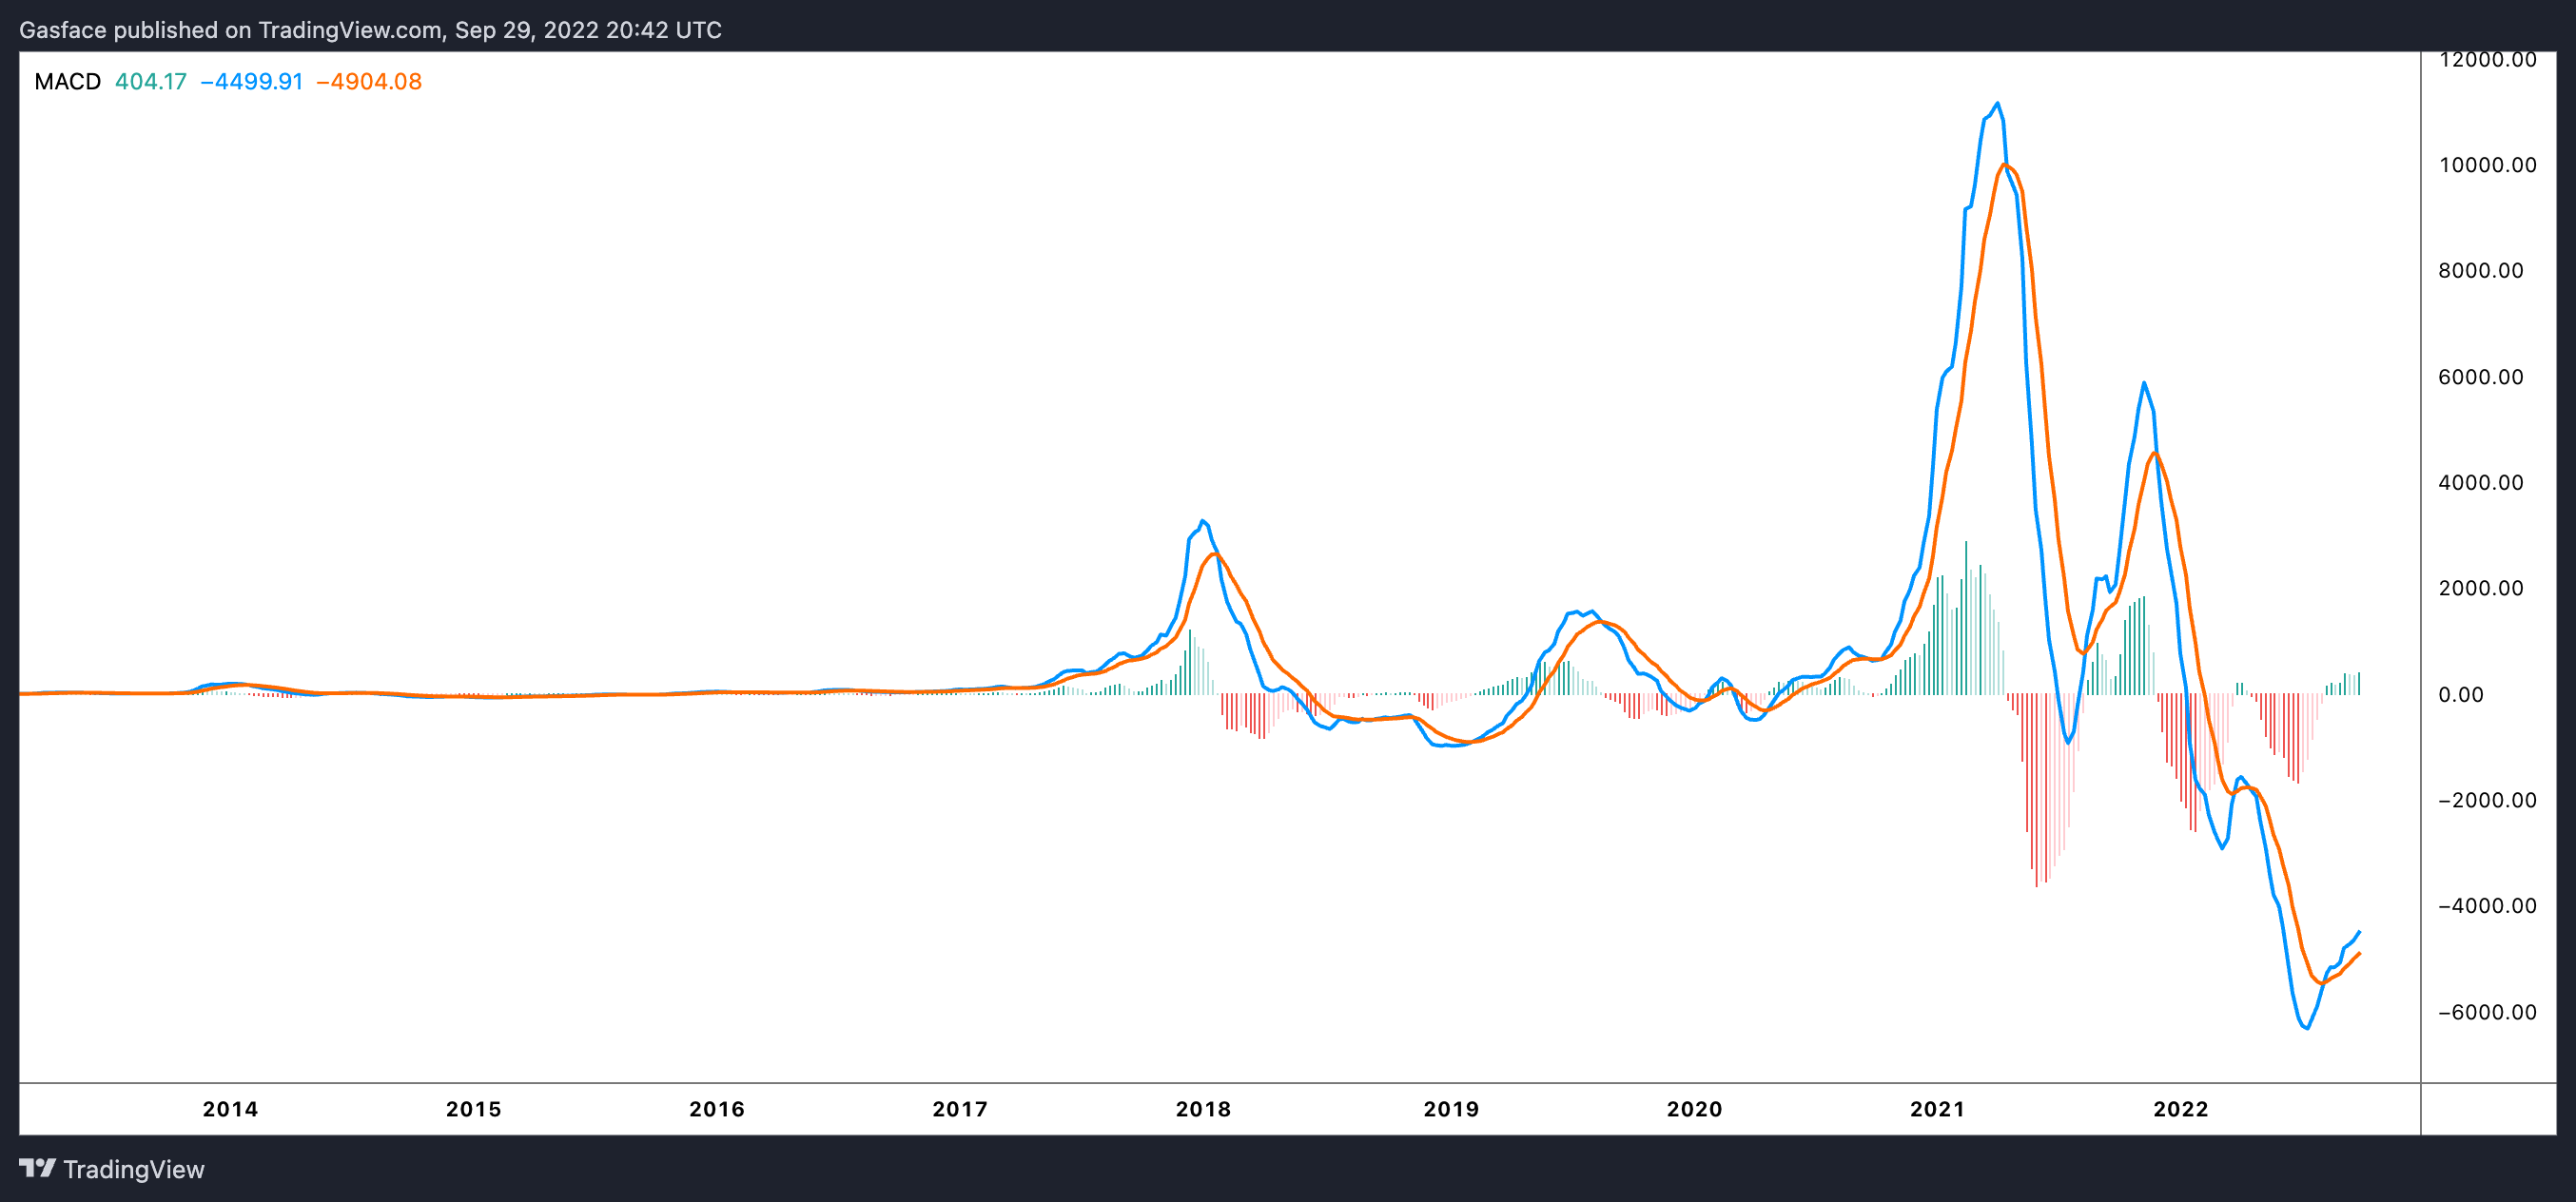
Although the histogram has changed from negative to positive, which some traders interpret as an early trend reversal sign, it should not be heavily relied upon in this case, given all the macro challenges facing cryptocurrency. While Bitcoin's price is painting lower highs and lower lows on the weekly chart, the RSI and MACD are moving in the opposite direction, known as bullish divergence.
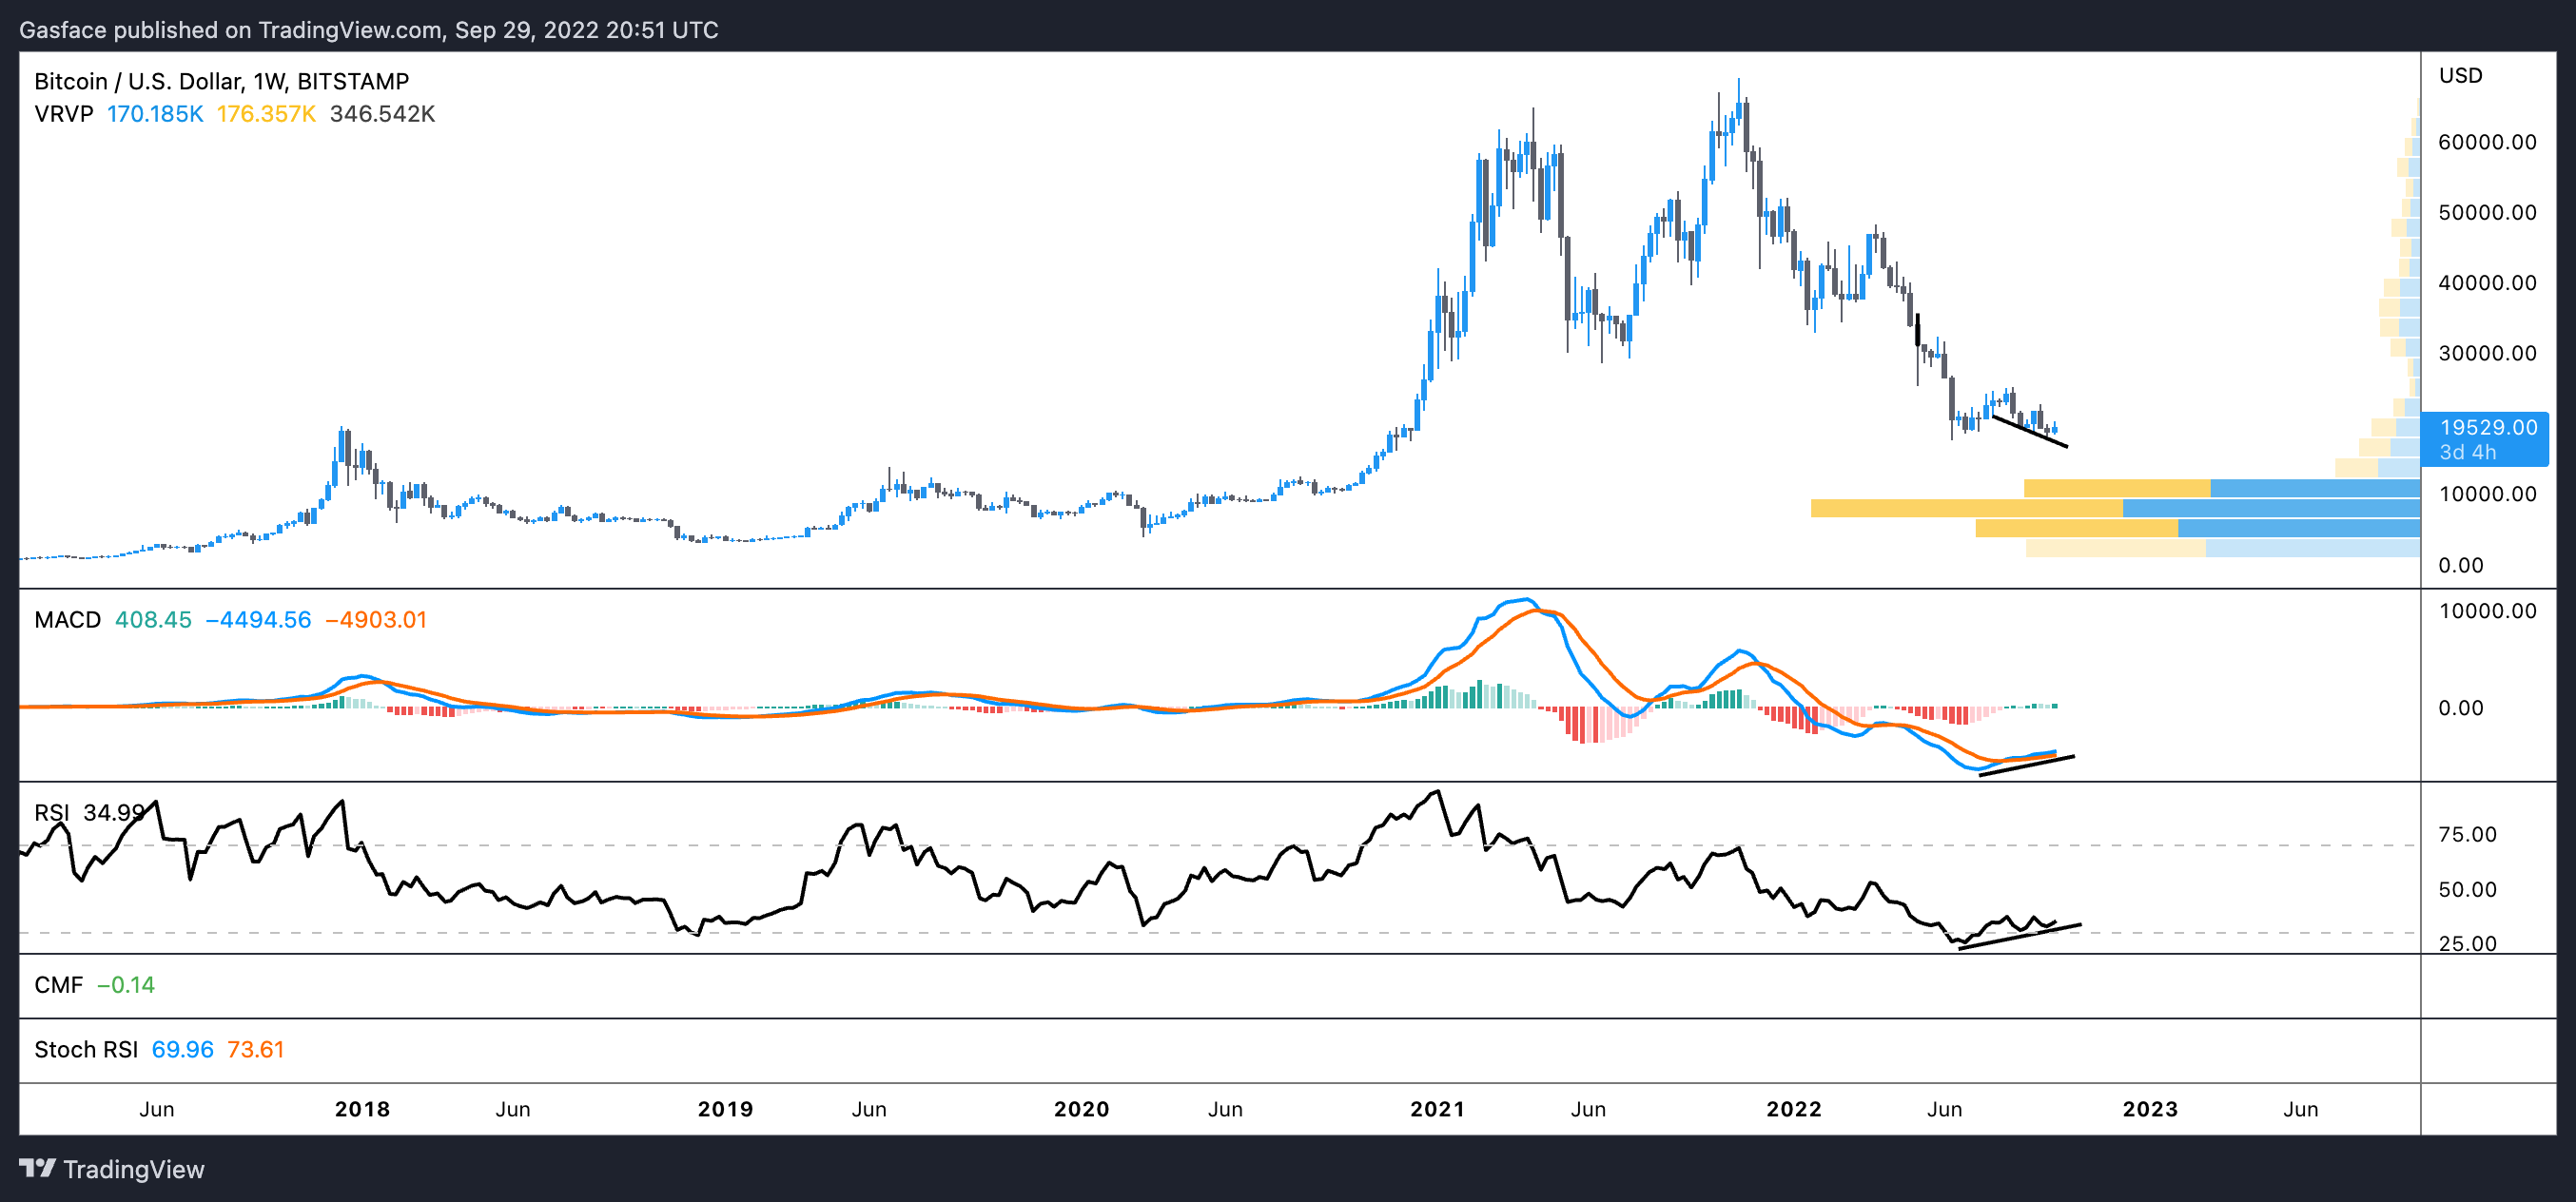
From a technical standpoint, several indicators point to Bitcoin being undervalued because the bottom does not appear to be in the slew of non-crypto-specific issues that continue to weigh on the price of BTC and the broader market. Although a decline to $10,000 is a further 48% decline from BTC's current price of around $20,000,
The MVRV Z-score, an on-chain indicator, compares the market capitalization of bitcoin (BTC) to its realized capitalization, or the price at which bitcoin was purchased about its current worth. David Puell, a co-creator of the metric, claims that it prominently highlights the price cycle's peaks and troughs and accentuates the oscillation between fear and greed. The realized value is brilliant because it significantly reduces all of the crowd's emotions.
When the measure enters the green zone, it means that Bitcoin's current value is below its realized price and that the market may be bottoming out. Conversely, when the metric enters the red area, Bitcoin's market value is demonstrably greater than its realized value.
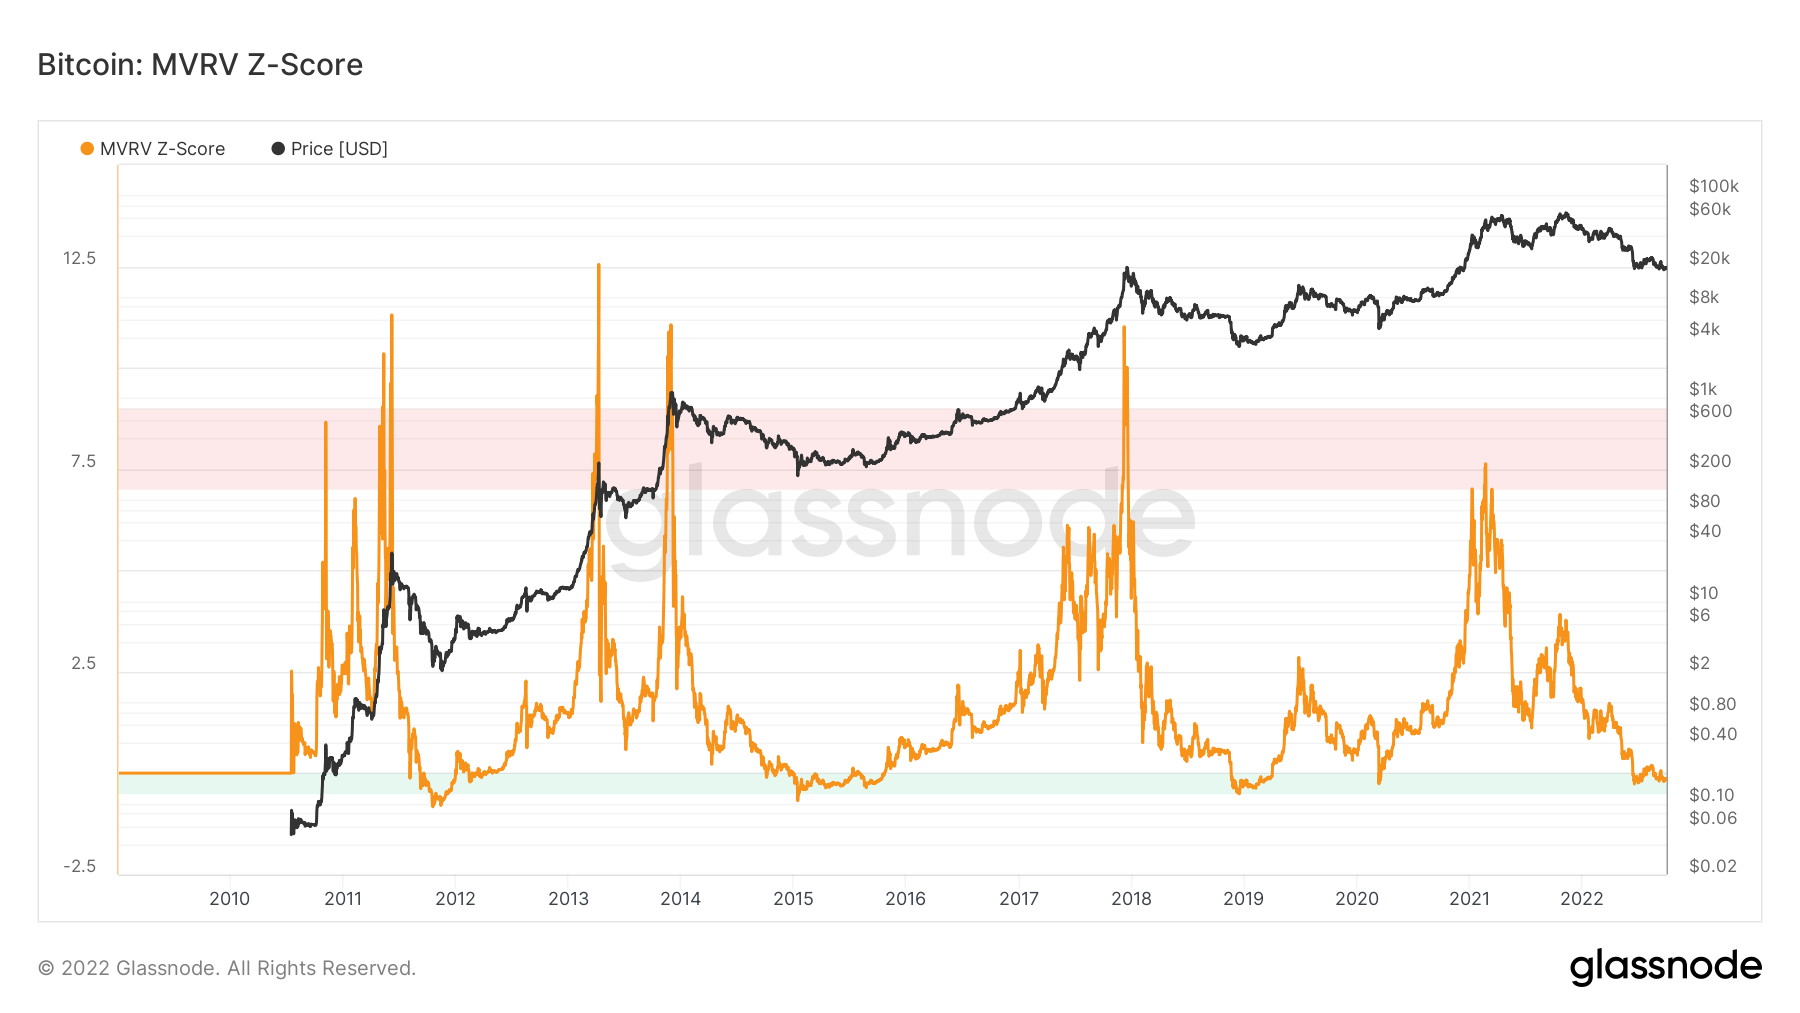
Comparing on-chain data to the previously mentioned technical analysis indicators reveals that BTC is undervalued and in an ideal zone for starting a long position. The current 0.127 MVRV Z-Score is in the same range as prior multi-year lows and cycle bottoms.
The Reserve Risk indicator by Hans Hauge, which provides a graphic of how confident Bitcoin investors are compared to the spot price of BTC, is another on-chain data point that presents interesting data. The risk-to-reward ratio, or the attractiveness of Bitcoin relative to the risk of buying and keeping BTC, moves into positive territory when investor confidence is high but the price of BTC is low.
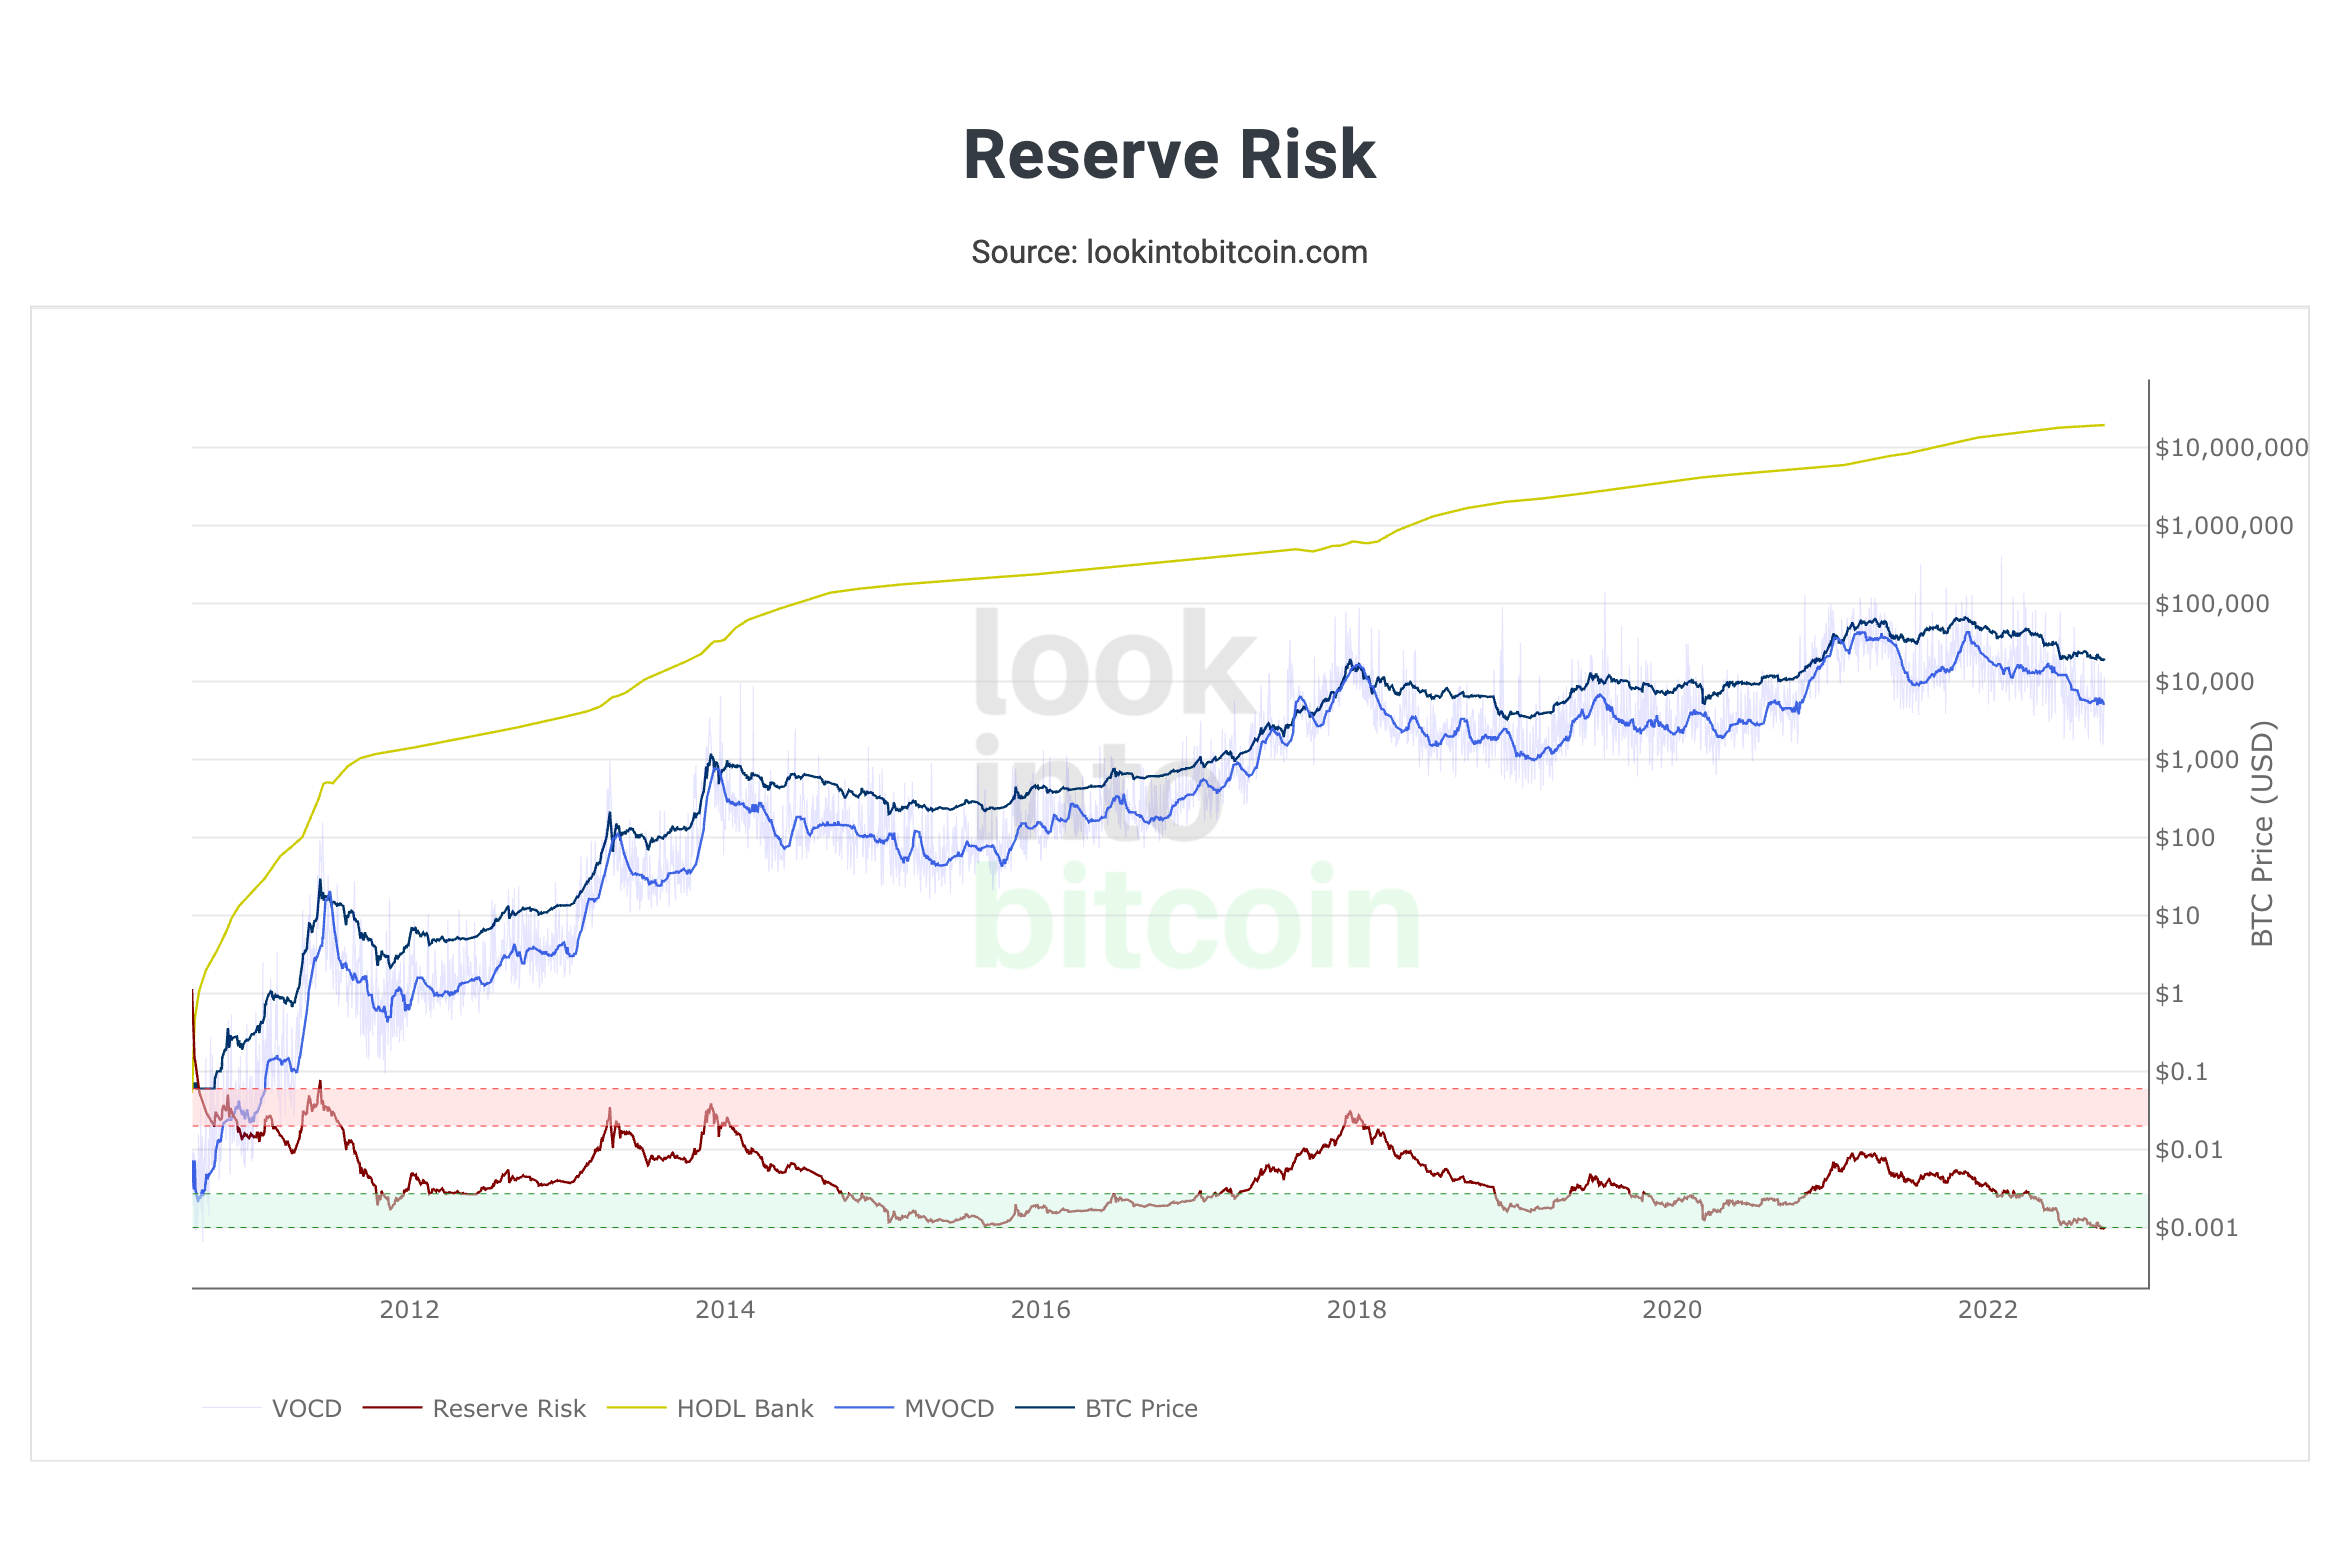
According to historical data, creating a Bitcoin position when Reserve Risk enters the green zone has always suggested an opportune moment for establishing a position. Reserve Risk rises into the red area when investor confidence is low, and the price is high. However, as of September 30, statistics from LookIntoBitcoin and Glassnode showed Reserve Risk trading outside the boundaries of the green zone and at its lowest reading ever.
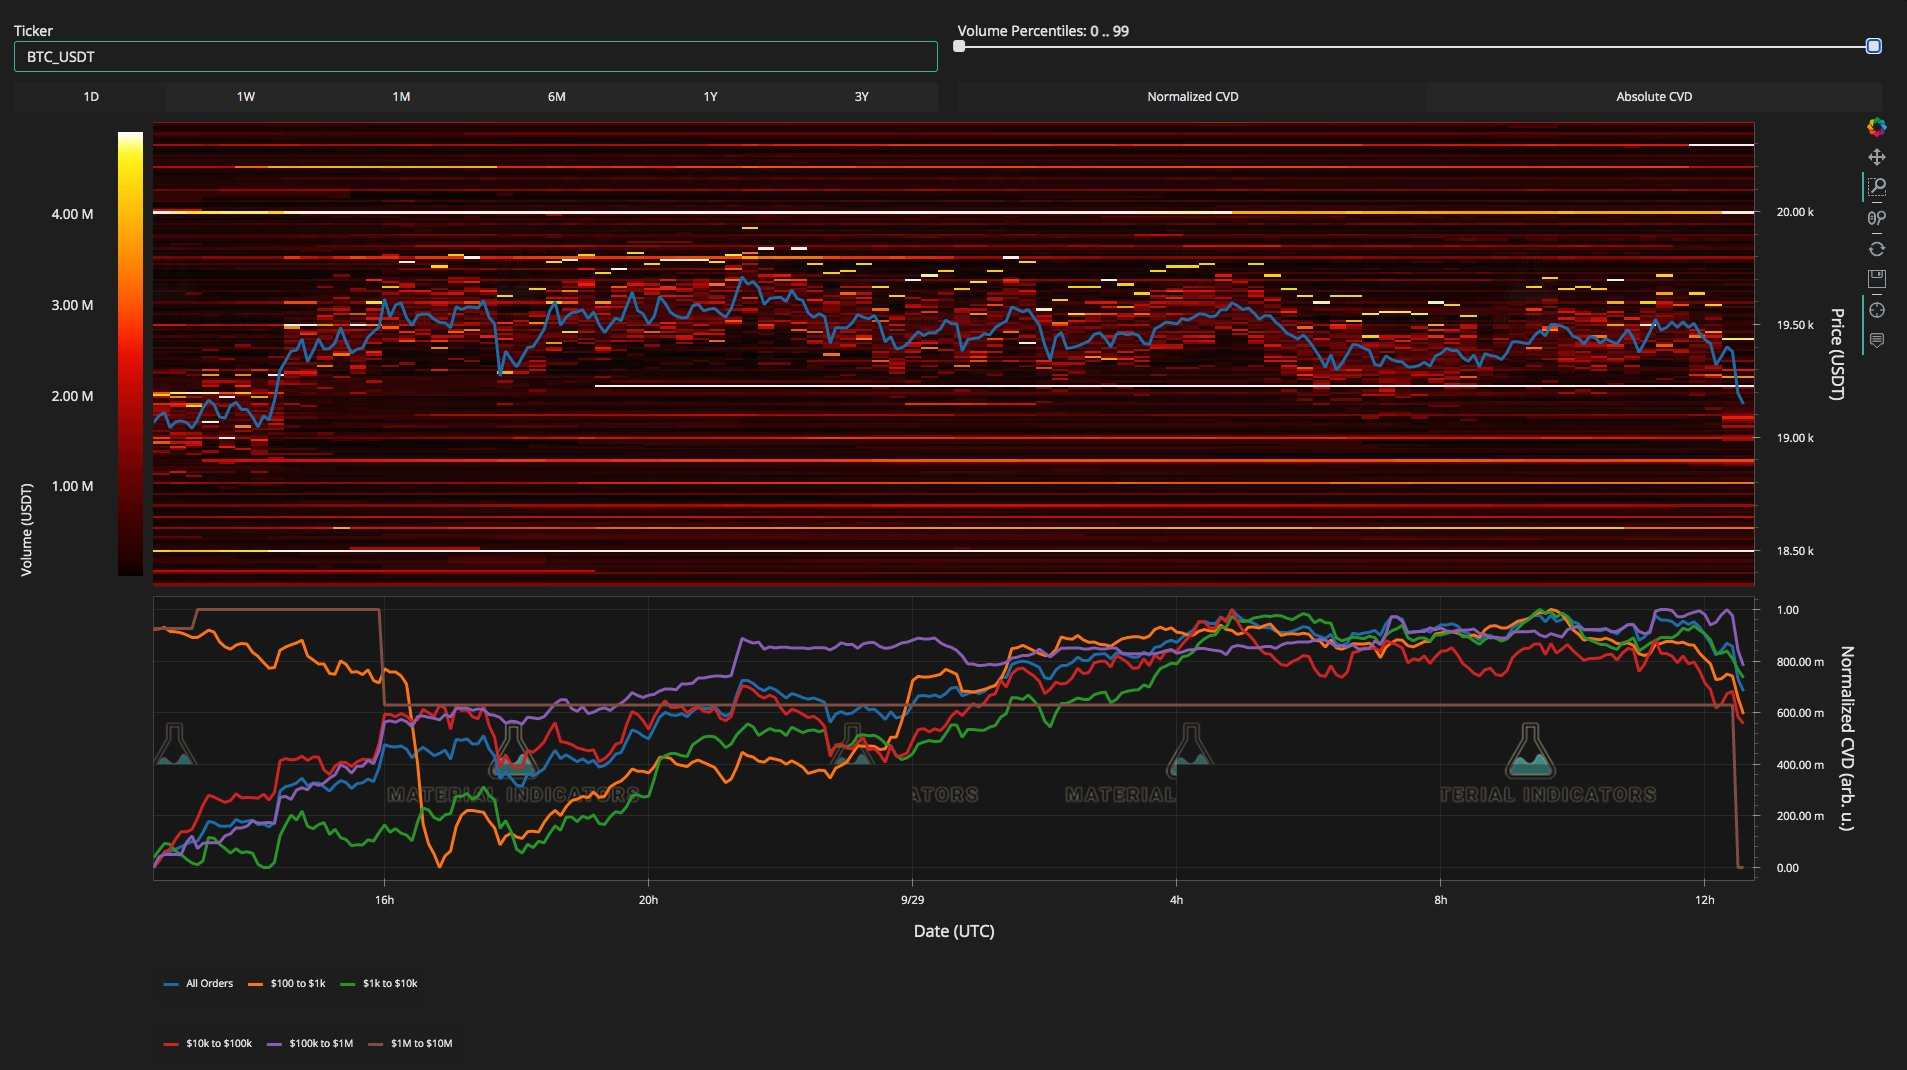
Despite this, the price movement of bitcoin managed to stay rather stable as new data came in and even after the monthly close yesterday. BTC/USD attempted to break through the $19,000 support at the time of writing, but it should be noted that the -0.6% GDP outcome was better than the anticipated -0.9% on-chain analytics resource. However, temporal indicators have a small cause to rejoice.
Material Indicators issued a warning alongside a screenshot of the Binance BTC/USD order book, stating that the market was not yet at its bottom and that the strong economic data indicated that the FED's tightening policy has not yet had much of an impact, with more aggressive rate hikes anticipated through the fourth quarter and into 2023.