
Bitcoin BTC saw a strong decline on September 6 and fell below $19,000 after trading around the $20,000 mark for several days. The decline was not isolated to the cryptocurrency markets, as the US stock market also experienced a decline that day. Risky assets have been under selling pressure over the past few days due to investors' concerns that the Federal Reserve (1) may keep up its hawkish tightening strategy.
The CME FedWatch Tool also extended the U.S. dollar index (2) (DXY) gain, which closed over 110 on September 6. It also showed a chance for a 75 basis point rate hike at the September meeting that had increased from 69% to over 80% over the previous week. The cryptocurrency and U.S. equity markets are trying to recover with relief rallies, but the recovery will probably not last after the DXY showed symptoms of topping out.
The bear market has been brutal, but it was encouraging to see venture capital firms continue to invest in blockchain and cryptocurrency businesses. According to a KPMG report (3), these firms invested $14.2 billion in these businesses in the first half of 2022, which is second only to the record $32.1 billion in 2021.
BTC/USDT
On September 6, the tight range that Bitcoin had been trading in between $19,250 and $20,576 resolved to the downside as the bears dragged the price to a strong support area between $18,910 and $18,626. The BTC/USDT pair could rally toward the breakdown level of $19,310 if the price bounces off the zone. If the bears successfully turn this level into resistance, the likelihood of a break below the support zone increases.
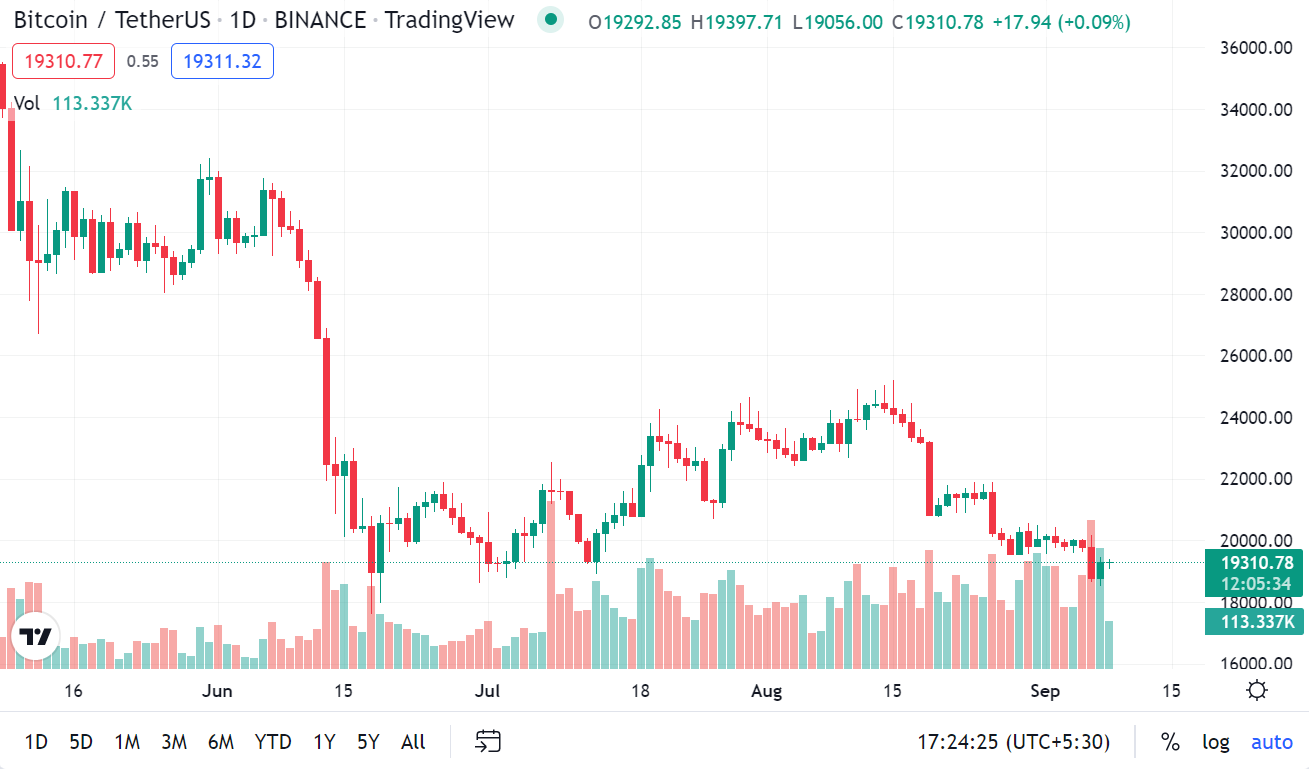
The bears are in control, as indicated by the downsloping 20-day exponential moving average (EMA) of $20,427 and the relative strength index (RSI) close to oversold territory, which could cause the pair to fall toward a critical support level at $17,622, and a break and close below the level could signal the resumption of the downtrend. A break and close above the 20-day EMA will be the first indication of strength because it will show that the bulls are trying to make a comeback.
ETH/USDT
On September 6, Ether ETH climbed above the moving averages, but the bears quickly sold out and dragged the price back down to the 20-day EMA, or $1,597, preventing the bulls from clearing the overhead barrier. The ETH/USDT pair could drop to $1,422 and then to the crucial support at $1,280 as the pattern goal for the bearish setup is $1,050 if the bears successfully sank the price below the neckline of the head and shoulders H&S pattern.
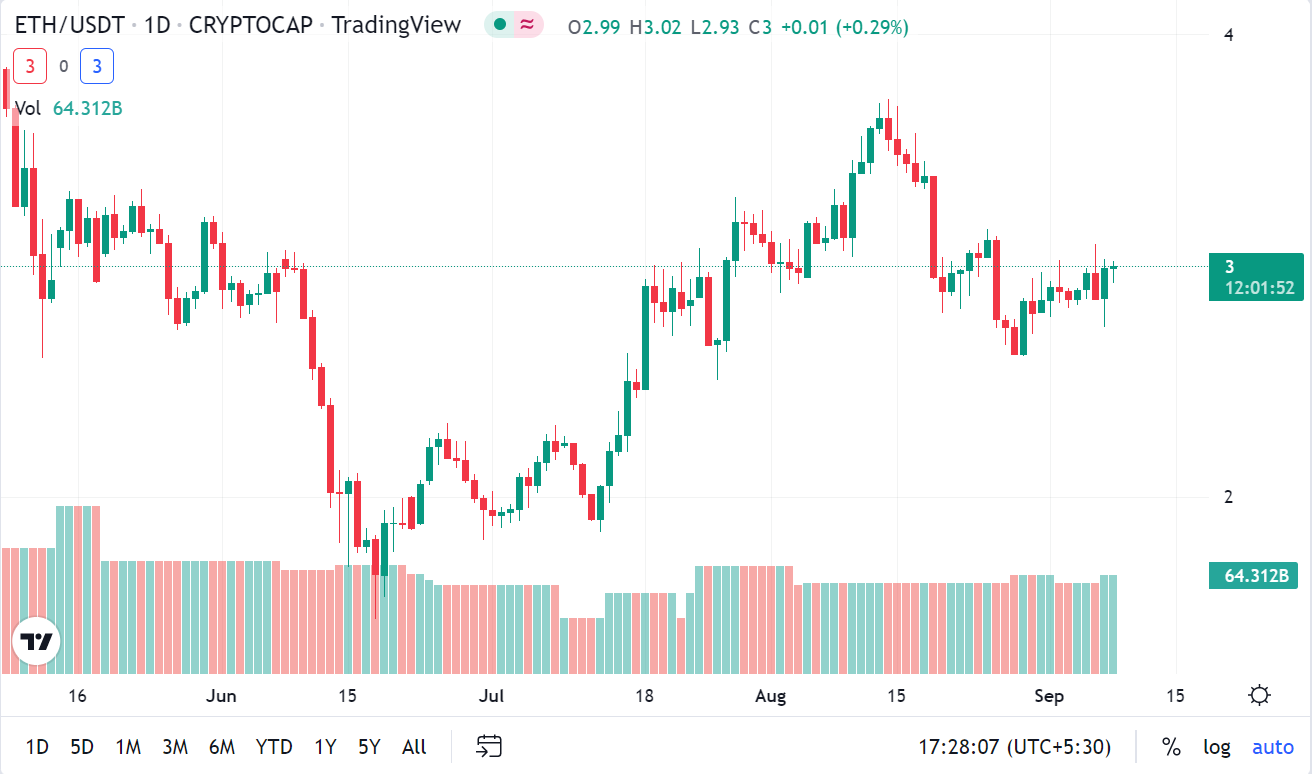
If the price rebounds off the neckline, it suggests that bulls should keep looking for opportunities to purchase on price declines. The pair may then consolidate between the neckline, and a break might close above $1,700, opening the door for a potential rise to $2,030.
BNB/USDT
On September 6, BNB made a sudden shift lower from the 20-day EMA, $282, and broke below the crucial support level of $275, completing a bearish H&S pattern. The price typically returns when key support has been broken to test the level. At this point, buyers aim to drive the price back over $275, and if they are successful, several aggressive bears may be caught.
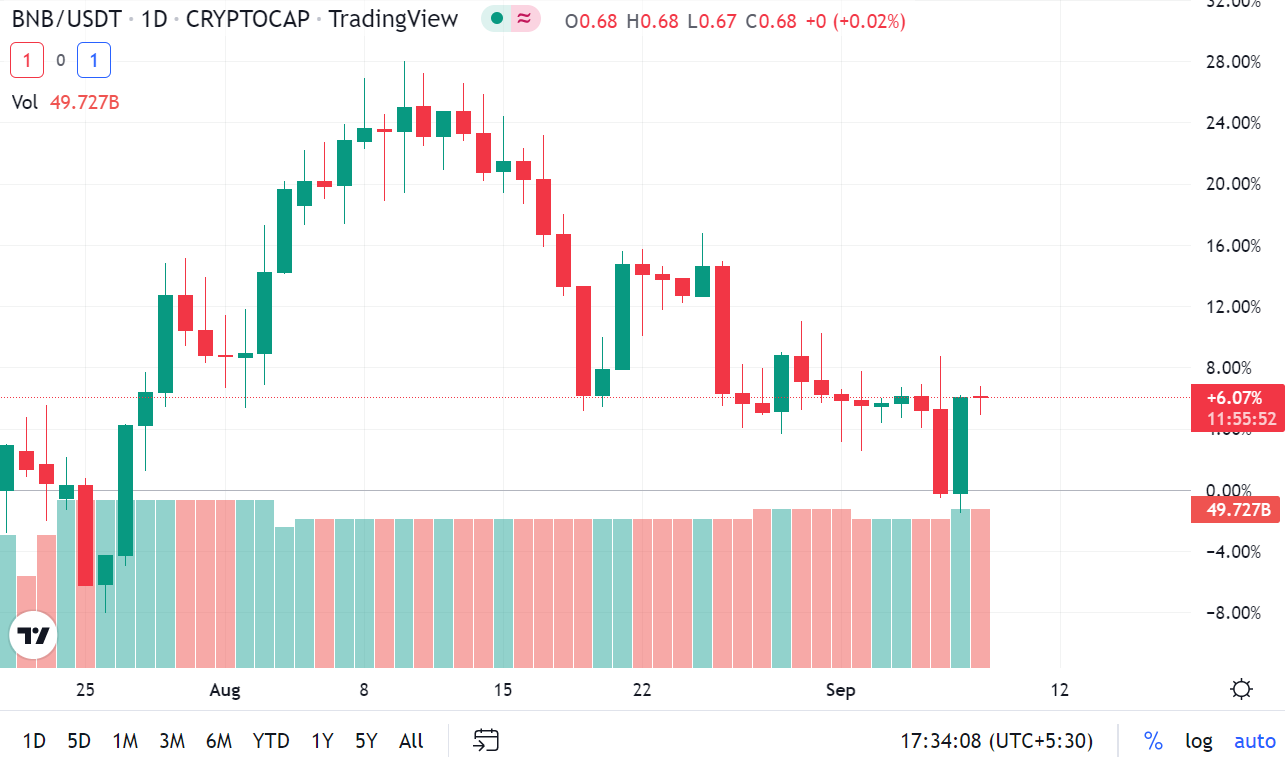
If the price declines from $275, it may indicate that the bears have turned the level of resistance, which may initiate a slide to $240; if this support also gives way, the next move may be a pattern targeting $212; this could lead to a short squeeze and a rebound to $308 for the BNB/USDT pair.
XRP/USDT
On September 6, the bulls drove XRP above the overhead resistance at $0.34, while the bears trapped by zealous buyers drove the price below the near-term support at $0.32. A minor plus is that the bulls prevented the price from remaining below $0.32.
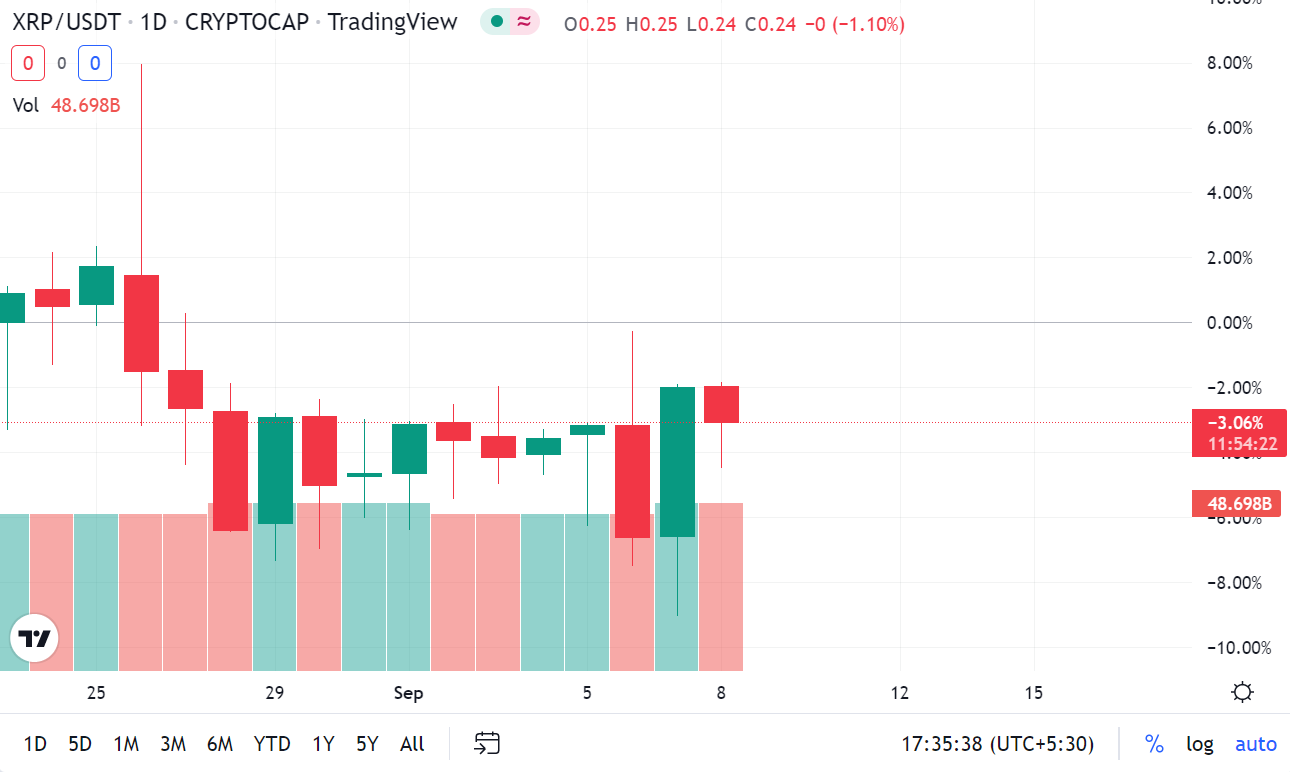
In contrast to this assumption, if the price turns down from the current level and sustains below $0.32, it will open the way for the potential decline to $0.30, and the bulls will probably defend this level with all their might. The long tail on the September 7 candlestick indicated buying at lower levels. If the price sustains above $0.32, the XRP/USDT pair will extend its range-bound action for some time.
ADA/USDT
As the bulls held the level on September 5 and the buyers attempted to prolong the relief rally on September 6, they were confronted with a wall of selling near $0.51. Cardano ADA closed above the 50-day simple moving average (SMA), which is 0.49, on September 4. Even though both moving averages are flattish and the RSI is just below the midpoint, which indicates range-bound action in the near term, the price turned down quickly and broke below them.
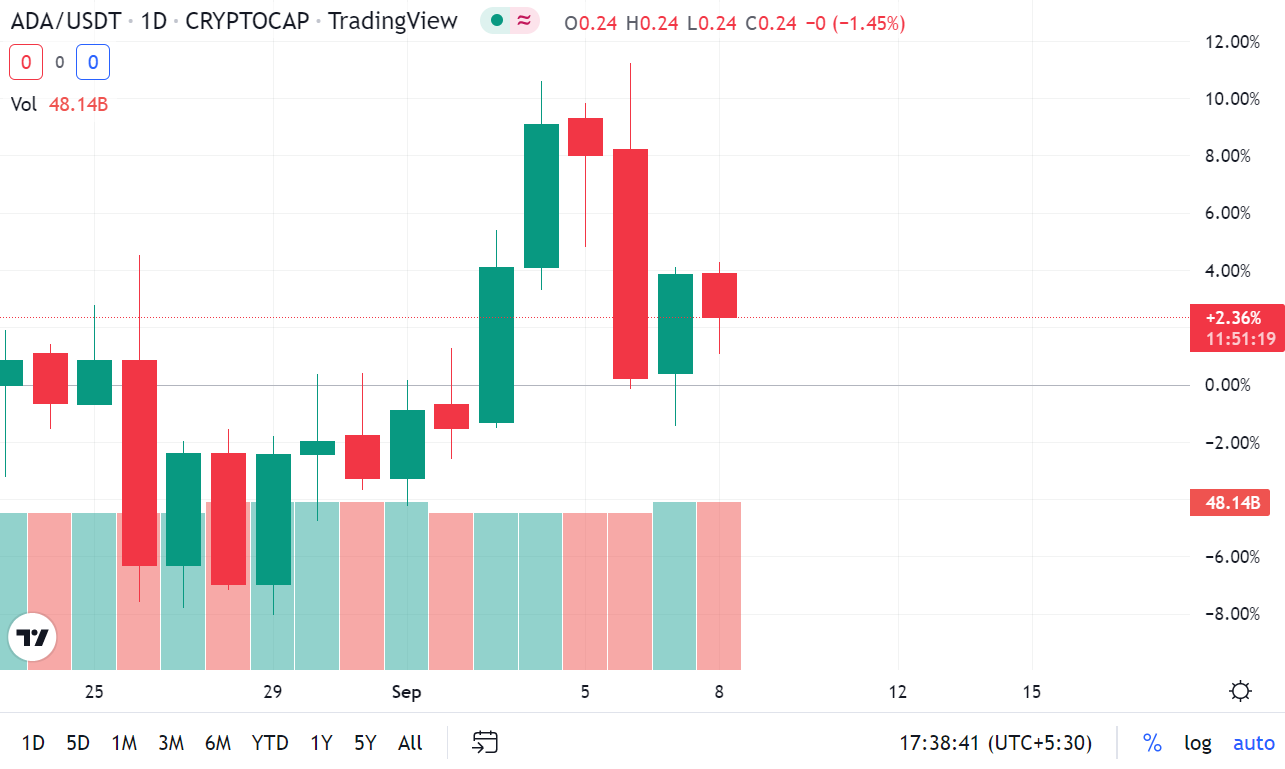
The ADA/USDT pair may fluctuate between $0.44 and $0.51 over the coming days. Bears will need to push the price below $0.44 to allow a drop to the key support level at $0.40, while bulls will need to push the price above $0.51 to allow a rebound to the downtrend line.
SOL/USDT
On September 6, Solana SOL rallied to the 20-day EMA at $33. Still, the bulls could not cross this resistance because it indicated that the sentiment remained negative and that traders were continuing to sell on rallies. However, one minor positive was that the bulls did not permit the price to fall below its intermediate support at $30.
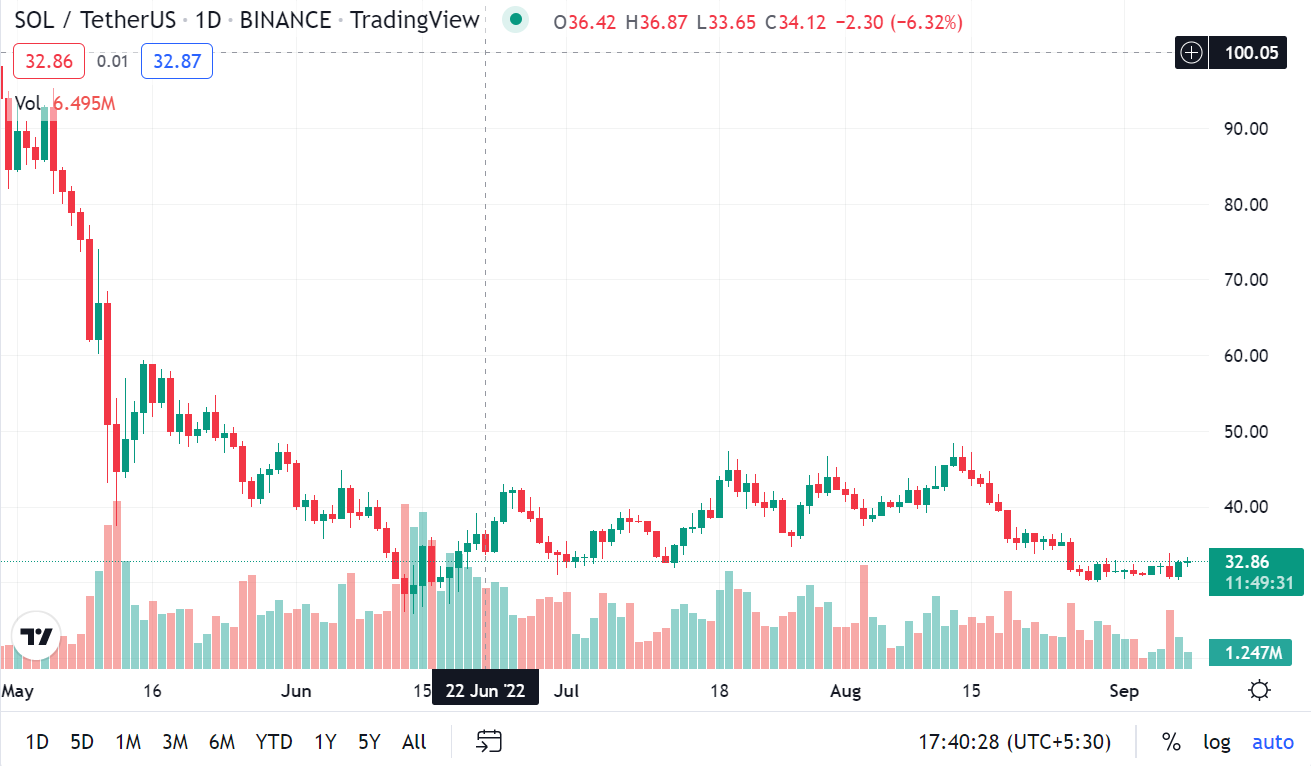
The bulls will try once more attempt to push the SOL/USDT pair above the 20-day EMA if the price moves upward from its current level, and if they are successful, the pair may climb to the 50-day SMA, which is $38. On the other hand, if the price declines and breaks below $30, the pair may continue to fall into the key support levels and could restart its downward trend.
DOGE/USDT
On September 6, the bulls attempted to push Dogecoin DOGE over the 20-day EMA, which is $0.06, but the bears quickly sold the surge and dragged the price below the immediate support level. On September 7, the buyers are seeking to push the price back over $0.06; if they are successful, the DOGE/USDT pair may climb once more to overhead resistance at the 20-day EMA.
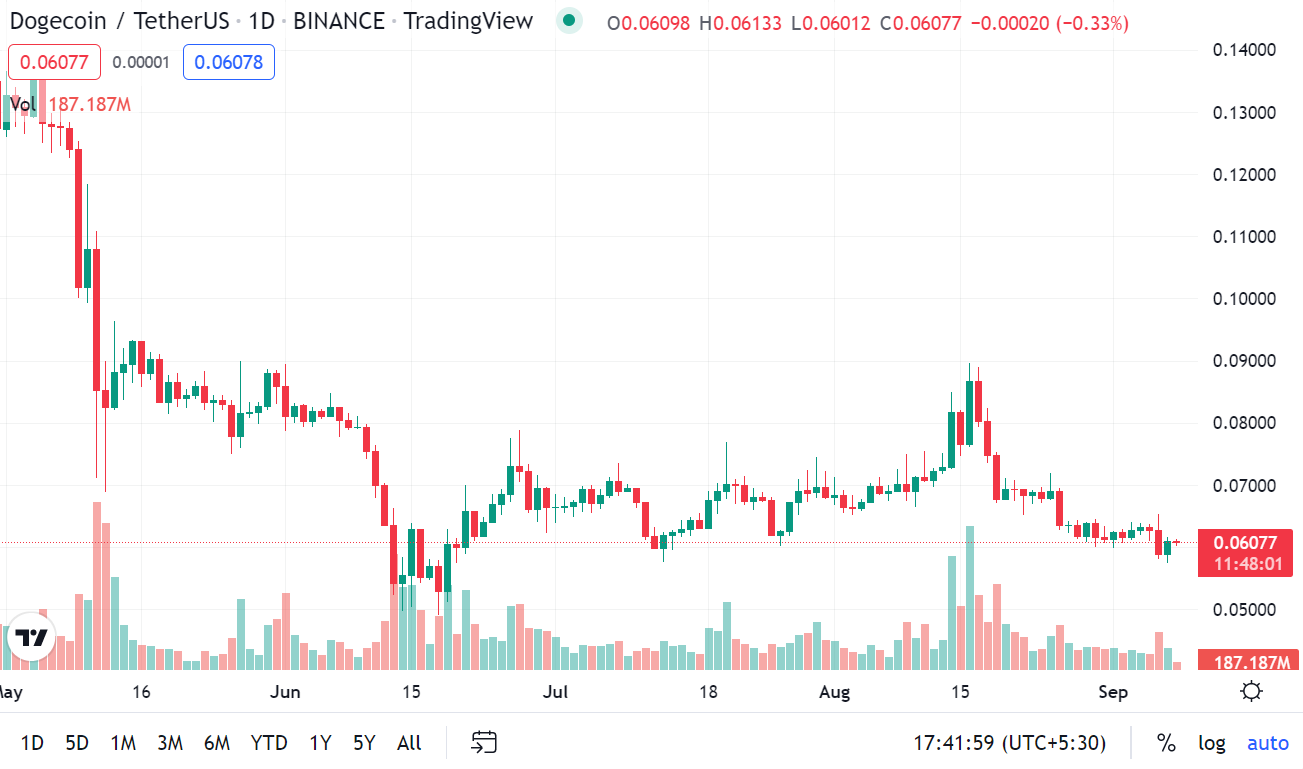
This level is still important to keep an eye on in the near term because a rally above it could even push the price to $0.07. However, contrary to expectations, if the price turns lower from $0.06 or the 20-day EMA, it will indicate that bears are selling on rallies and could increase the likelihood of a drop to strong support at $0.05.
DOT/USDT
On September 5 and 6, most purchasers attempted to push Polkadot DOT above the moving averages, but the bears resolutely held the level, as seen by the lengthy wick on the candlesticks. The RSI is in the negative territory, favors the sellers, and the 20-day EMA is $7.38 and sloping down.
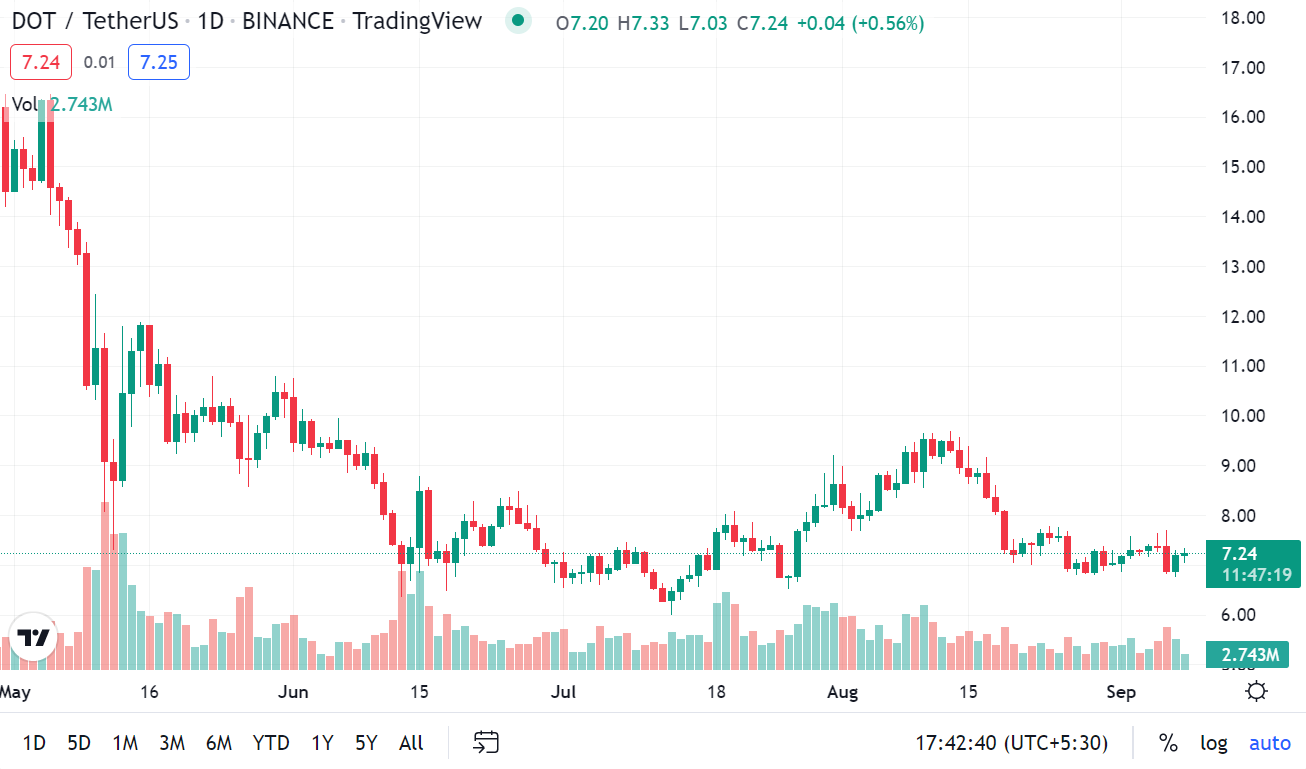
The DOT/USDT pair could drop to the critical level at $6 if the bears push the price below the immediate support at $6.79. At this point, the bulls are expected to stage a robust defense. As an alternative, buying on dips would be advised if the price rose from its current level and broke through the moving averages. This would take the pair to $9.17 and eventually the overhead resistance level of $10.
MATIC/USDT
On September 5, the buyers attempted to continue the rebound by holding the 50-day SMA at $0.87; however, the bears had other ideas and aggressively sold around $0.92, bringing Polygon MATIC down below the moving averages. The 20-day EMA of $0.85 has begun to shift downward, and the RSI is close to 46, suggesting that the bears may have a tiny advantage.
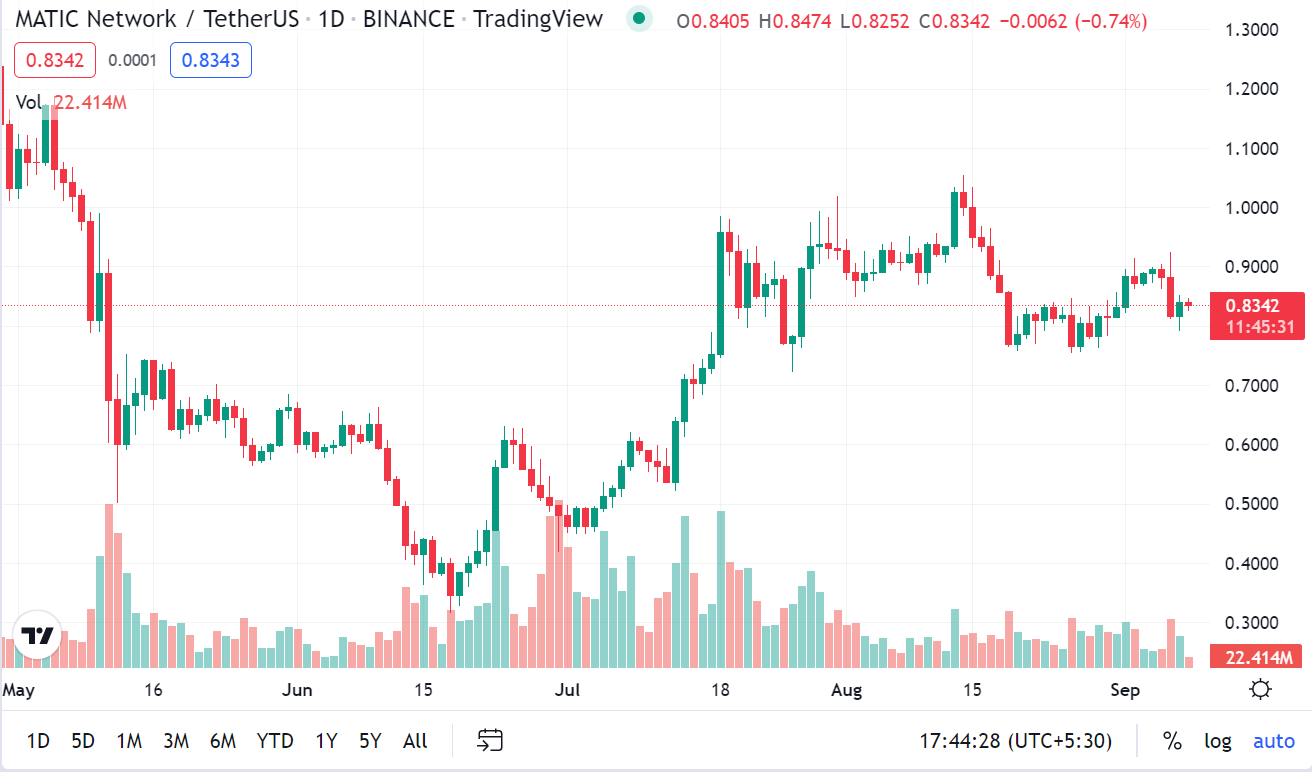
Sellers will then try to push the price down to the significant support level at $0.75. If this level is broken and closed below, a bearish H&S pattern could be completed, and the MATIC/USDT pair could begin declining to $0.63 and eventually the pattern target of $0.45. If the bulls can push the pair past $0.93 and up to the significant overhead resistance at $1.05.This bearish thesis could also become worthless shortly.
SHIB/USDT
The bulls bought the Shiba Inu SHIB drop on September 5, but they could not keep the price above the 20-day EMA, which is $0.000013, showing that bears are selling on every small uptick. The 20-day EMA's downward shift and the RSI's proximity to the midpoint indicate a slight advantage for the bears.
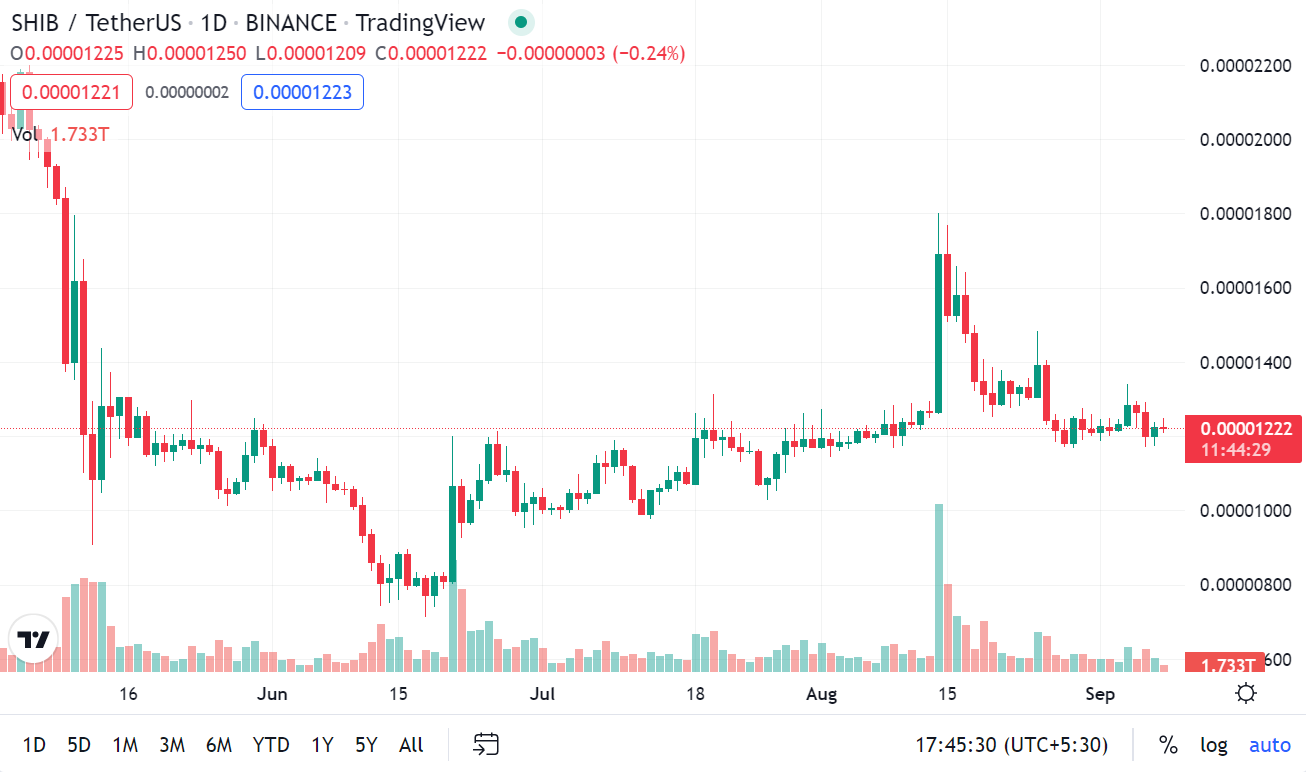
The sellers will make an effort to drive the price down to the psychological support at $0.000010 and subsequently to $0.000009 because it is anticipated that buyers will vigorously defend the support zone. Another scenario is that the price moves upward from its current level and surpasses the moving averages, indicating lower-level selling has peaked. The SHIB/USDT pair would increase to $0.000015 and then $0.000018.
The thoughts and opinions expressed are purely those of the author and do not represent the views of cryptocurrency.news.


